
ACT Score Chart 2026: Raw-to-Scaled Conversion Guide
Miyagi Labs ·
ACT Score Chart 2026: Raw-to-Scaled Conversion Guide

TL;DR
An ACT score chart converts the number of correct answers on each section into a 1–36 scaled score. On the current Enhanced ACT, English, Math, and Reading determine the Composite, while Science is optional and scored separately. ACT uses form-specific raw-to-scaled conversions, so there is no single universal chart. The tables below show a sample Enhanced ACT conversion and should be used with the scoring key for your specific test whenever available.
Jump to: English Chart | Math Chart | Reading Chart | Science Chart | Composite Calculator | Percentiles
ACT Score Chart 2026: At a Glance
The current ACT has three sections that determine the Composite score: English, Math, and Reading. Science is optional and receives its own score when taken. Writing is also optional and is scored separately.
Section | Questions Shown | Scored Questions | Time | Counts Toward Composite? |
|---|---|---|---|---|
English | 50 | 40 | 35 minutes | Yes |
Math | 45 | 41 | 50 minutes | Yes |
Reading | 36 | 27 | 40 minutes | Yes |
Science | 40 | 34 | 40 minutes | No, optional |
Writing | 1 essay | — | 40 minutes | No |
The ACT reports section scores on a 1–36 scale. The current Composite is calculated from English, Math, and Reading only.
What Is an ACT Score Chart?
An ACT score chart converts a raw score into a scaled score from 1 to 36.
The three terms to understand are:
Term | Meaning | Example |
|---|---|---|
Raw score | Number of scored questions answered correctly | 33 correct in Math |
Scale score | ACT section score from 1–36 | Math: 30 |
Composite | Rounded average of English, Math, and Reading | (31 + 28 + 30) ÷ 3 = 30 |
The raw score is the number of correct scored questions. The scale score is the standardized result reported by ACT. The Composite is the rounded average of the English, Math, and Reading scale scores on the current Enhanced ACT.
Because ACT uses form-specific conversion tables, the same raw score can produce different scale scores on different test forms.
Is There One Official ACT Score Chart?
No. There is not one universal raw-to-scaled ACT score chart that applies to every test form.
ACT converts raw scores into scale scores using scoring information specific to the test form. This means the number of correct answers needed for a particular 1–36 score can change from one form to another.
For practice tests, the most accurate approach is to use the scoring key provided with that specific test. A generic ACT score chart can be useful for estimating performance, but it should not replace the form-specific scoring key when one is available.
Bottom line: Use your test's official scoring key first. Use a sample ACT score chart for estimation and planning.
ACT Raw-to-Scaled Score Charts for 2026
The following tables show the relationship between raw scores and scaled ACT section scores for the sample Enhanced ACT form used on this page.
Use the raw score column to find the number of scored questions answered correctly, then read across to the corresponding 1–36 scale score.
Important: These are sample-form conversion tables. Your official practice test's scoring key should take priority when one is provided.
Want to score a practice test with analytics built in? Take a free ACT practice test with section-by-section breakdowns.
How to Read an ACT Score Chart
Use an ACT raw-to-scaled chart in five steps:
Count your correct answers. Your raw score is the number of scored questions you answered correctly.
Use the scored-question total. Do not assume every question displayed on the test contributes to your raw score.
Find your raw score in the section table. Use the conversion table for the specific practice test whenever available.
Read the corresponding scale score. The ACT section score is reported on a 1–36 scale.
Calculate your Composite. For the current Enhanced ACT, add your English, Math, and Reading scores and divide by 3.
For example, ACT's official Enhanced Online Practice Test scoring key maps a Math raw score of 33 out of 41 to a Math scale score of 30. That mapping applies to that sample form and should not be treated as a universal ACT conversion.
Important: There Is No Universal ACT Raw-to-Scaled Score Chart
ACT does not use one fixed raw-to-scaled conversion for every test form. The number of correct answers required for a particular 1–36 score can vary between forms because ACT uses form-specific scoring conversions.
For example, an official Enhanced ACT practice scoring key maps 33 correct Math answers to a 30 Math score. A different ACT form may use a different conversion.
If your official practice test includes its own scoring key, use that key first. The tables on this page are sample-form conversions for practice and planning, not a guaranteed conversion for every 2026 ACT test date.
English Score Chart (40 Scored Questions)
Raw Score | Scaled Score | Raw Score | Scaled Score | |
|---|---|---|---|---|
40 | 36 | 19 | 18 | |
39 | 35 | 18 | 17 | |
38 | 34 | 17 | 16 | |
37 | 33 | 16 | 16 | |
36 | 32 | 15 | 15 | |
35 | 31 | 14 | 14 | |
34 | 30 | 13 | 13 | |
33 | 29 | 12 | 13 | |
32 | 28 | 11 | 12 | |
31 | 27 | 10 | 11 | |
30 | 26 | 9 | 10 | |
29 | 25 | 8 | 9 | |
28 | 25 | 7 | 8 | |
27 | 24 | 6 | 7 | |
26 | 23 | 5 | 7 | |
25 | 22 | 4 | 6 | |
24 | 21 | 3 | 5 | |
23 | 21 | 2 | 4 | |
22 | 20 | 1 | 3 | |
21 | 19 | 0 | 1 | |
20 | 18 |
Key takeaway: You can miss about 6 questions and still score a 30 in English on most forms.
Math Score Chart (41 Scored Questions)
Raw Score | Scaled Score | Raw Score | Scaled Score | |
|---|---|---|---|---|
41 | 36 | 20 | 19 | |
40 | 35 | 19 | 18 | |
39 | 34 | 18 | 17 | |
38 | 33 | 17 | 17 | |
37 | 32 | 16 | 16 | |
36 | 31 | 15 | 15 | |
35 | 30 | 14 | 15 | |
34 | 29 | 13 | 14 | |
33 | 29 | 12 | 13 | |
32 | 28 | 11 | 13 | |
31 | 27 | 10 | 12 | |
30 | 26 | 9 | 11 | |
29 | 26 | 8 | 10 | |
28 | 25 | 7 | 10 | |
27 | 24 | 6 | 9 | |
26 | 23 | 5 | 8 | |
25 | 23 | 4 | 7 | |
24 | 22 | 3 | 6 | |
23 | 21 | 2 | 5 | |
22 | 20 | 1 | 3 | |
21 | 20 | 0 | 1 |
Key takeaway: Math has the tightest conversion of the three Composite sections. Missing 6 questions typically puts you around a 30.
Reading Score Chart (27 Scored Questions)
Raw Score | Scaled Score |
|---|---|
27 | 36 |
26 | 35 |
25 | 33 |
24 | 31 |
23 | 30 |
22 | 28 |
21 | 27 |
20 | 26 |
19 | 25 |
18 | 24 |
17 | 23 |
16 | 22 |
15 | 21 |
14 | 20 |
13 | 19 |
12 | 18 |
11 | 17 |
10 | 16 |
9 | 15 |
8 | 14 |
7 | 13 |
6 | 12 |
5 | 11 |
4 | 10 |
3 | 8 |
2 | 6 |
1 | 4 |
0 | 1 |
Key takeaway: With only 27 scored questions, each one carries more weight. Missing just 4 questions can drop you from a 36 to a 31. Reading accuracy matters more per question than any other section.
Science Score Chart (34 Scored Questions, Optional)
Science no longer counts toward the Composite on the Enhanced ACT, but it is still scored on the 1–36 scale if you take it.
Raw Score | Scaled Score | Raw Score | Scaled Score | |
|---|---|---|---|---|
34 | 36 | 16 | 18 | |
33 | 35 | 15 | 17 | |
32 | 33 | 14 | 17 | |
31 | 32 | 13 | 16 | |
30 | 31 | 12 | 15 | |
29 | 30 | 11 | 14 | |
28 | 29 | 10 | 13 | |
27 | 28 | 9 | 13 | |
26 | 27 | 8 | 12 | |
25 | 26 | 7 | 11 | |
24 | 25 | 6 | 10 | |
23 | 24 | 5 | 9 | |
22 | 24 | 4 | 8 | |
21 | 23 | 3 | 7 | |
20 | 22 | 2 | 5 | |
19 | 21 | 1 | 3 | |
18 | 20 | 0 | 1 | |
17 | 19 |
Quick Composite Calculator
Once you have your three scaled scores from the charts above, here’s the formula:
(English + Math + Reading) ÷ 3 = Composite
Round to the nearest whole number (0.5 rounds up).
Example: English 31 + Math 28 + Reading 30 = 89. Then 89 ÷ 3 = 29.67, which rounds to Composite 30.
For a tool that does this automatically and tracks your scores over time, try the ACT score predictor.
What Is an ACT Score Chart?
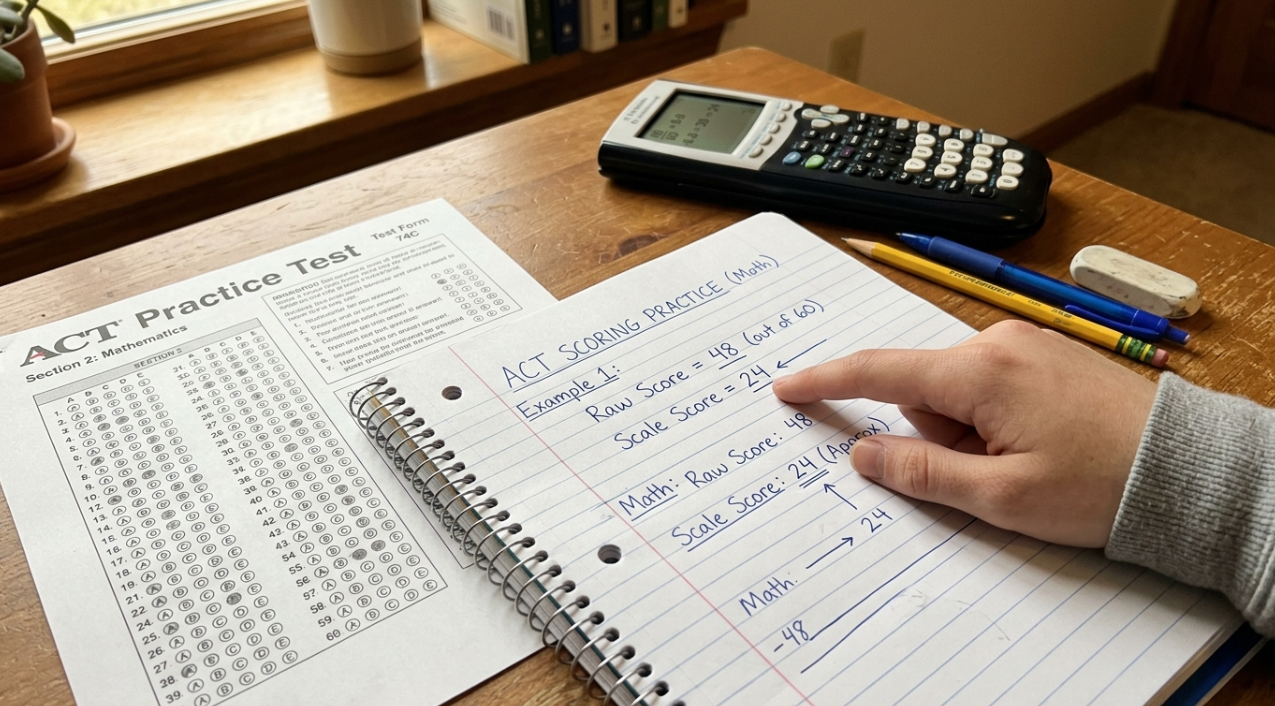
An ACT score chart is a table that converts your raw score (the number of scored questions you answered correctly) into a scaled section score on the 1–36 ACT scale. Every ACT section, whether English, Math, or Reading, uses this kind of conversion table to translate performance into a standardized number.
The reason the chart exists is simple. Not every ACT test form has the same difficulty. A raw score of 35 correct on one Math form might reflect the same ability as 37 correct on another. ACT uses a statistical process called equating to adjust for these differences, and the score chart captures the result of that adjustment.
Here is how the key terms relate to each other:
Term | What it means | Example |
|---|---|---|
Raw score | Number of scored questions correct | 30 correct on Math |
Scaled score | Section score on the 1–36 scale | Math: 28 |
Composite score | Rounded average of section scale scores | Enhanced ACT: (E + M + R) ÷ 3 |
Think of it this way. Your raw score is the input. The ACT score chart is the translator. Your scaled score is the output.
If you want to see how scoring works in practice, take an ACT practice test with built-in analytics so you can track section-by-section performance alongside the conversion.
Is There One Official ACT Score Chart?
No. This is the biggest misconception students bring to the search. Many people look for “the ACT score chart” as if a single fixed table applies to every test date. It doesn’t work that way.
ACT creates multiple test forms throughout the year. Because questions differ in difficulty from one form to the next, the raw-to-scaled conversion shifts slightly. ACT’s own materials explain that raw scores are converted to scale scores specifically so that scores remain comparable across different forms.
Practitioners on Reddit consistently reinforce this. When students ask whether a specific raw-score conversion table from a prep book will apply to their upcoming ACT, experienced test-takers reply that each test has its own chart and that the exact conversion is never guaranteed in advance.
The practical takeaway: if your practice test includes its own scoring key, use that chart. The conversion tables at the top of this page are estimates based on a sample Enhanced ACT form. They are accurate enough for goal setting and practice scoring, but the exact chart for your test date will be determined by ACT after equating.
How to Use an ACT Score Chart
Using an ACT score chart is straightforward once you understand the steps. Here is the process, based on ACT’s official scoring instructions:
Score your answer sheet. Mark each correct answer. There is no penalty for wrong answers on the ACT, so every correct response earns one point.
Count only scored (operational) questions. Some questions on the Enhanced ACT are embedded field-test items that do not count. More on this below.
Find your section’s raw score in the conversion chart. Look up the raw score in the table for that specific section and test form. (If you don’t have a form-specific chart, use the approximate charts above.)
Read the corresponding scaled score. That’s your 1–36 section score.
Repeat for each section. Do this for English, Math, and Reading at minimum.
Calculate your Composite. On the Enhanced ACT, add your English, Math, and Reading scaled scores, divide by 3, and round to the nearest whole number.
A quick note on step 2: on the Enhanced ACT, the number of questions you see on test day is not the same as the number that counts toward your raw score. ACT embeds field-test items that look like regular questions but are not scored. The official scoring key instructs students to skip these when tallying raw scores.
Enhanced ACT Scoring: What Changed in 2025–2026
The Enhanced ACT brought significant changes to how scores work, and many ACT score chart resources online have not caught up. Some major prep sites still describe the old four-section Composite formula, which creates real confusion.
Here is what changed, according to ACT’s official guidance:
Science became optional. It is still offered and still scored on the 1–36 scale, but it no longer counts toward the Composite.
Composite now uses three sections. The formula changed from (English + Math + Reading + Science) ÷ 4 to (English + Math + Reading) ÷ 3.
The test got shorter, but field-test items were added. Each section now includes embedded experimental questions that ACT uses for future test development. These items are not scored.
The score scale stayed the same. A 30 on the Enhanced ACT is intended to mean the same level of performance as a 30 on the legacy ACT, according to ACT’s linking study.
The Enhanced ACT rolled out for national online testing in April 2025, for national paper testing in September 2025, and for state/district testing starting spring 2026.
Legacy vs. Enhanced ACT Composite
Test version | Sections in Composite | Formula |
|---|---|---|
Enhanced ACT (current) | English, Math, Reading | (E + M + R) ÷ 3 |
Legacy ACT | English, Math, Reading, Science | (E + M + R + S) ÷ 4 |
If you are using older practice materials, you may need to adjust your scoring method. For resources specifically built around current ACT scoring, explore the best free ACT prep options available.
Visible Questions vs. Scored Questions

This is a detail most ACT score chart pages miss entirely. The Enhanced ACT includes field-test items mixed into each section. You cannot tell which questions are field-test items, but they do not count toward your raw score. ACT’s official Enhanced ACT scoring key confirms the operational question counts differ from visible totals:
Section | Visible questions | Scored operational questions | Time |
|---|---|---|---|
English | 50 | 40 | 35 minutes |
Math | 45 | 41 | 50 minutes |
Reading | 36 | 27 | 40 minutes |
Science (optional) | 40 | 34 | 40 minutes |
This matters because if you are building an ACT score chart estimate based on visible question counts, your raw score denominator will be wrong. Always use the operational question count when scoring official practice tests. The conversion charts at the top of this page already use the correct operational counts.
How to Calculate Your ACT Composite Score
The Composite score is what most colleges see first. On the Enhanced ACT, the formula is:
(English scale score + Math scale score + Reading scale score) ÷ 3
Round to the nearest whole number. Fractions below one-half round down. One-half or more rounds up.
Example 1: Standard Calculation
A student earns English 31, Math 28, Reading 30.
31 + 28 + 30 = 89
89 ÷ 3 = 29.67
Rounded Composite = 30
Example 2: When Science Doesn’t Move the Needle
A student earns English 36, Math 34, Reading 33, Science 36.
Under the Enhanced ACT:
36 + 34 + 33 = 103
103 ÷ 3 = 34.33
Composite = 34
Under the legacy formula, this same student would have scored (36 + 34 + 33 + 36) ÷ 4 = 34.75, rounding to 35. The Science score would have pushed the Composite up by a full point.
This exact frustration appears in student communities. One Reddit user described getting a 34 Composite under the new scoring when a legacy calculation would have produced a 35, generating significant discussion about the fairness of the change.
Composite Threshold Table
Because the Enhanced ACT Composite depends on only three section scores, you can work backwards to figure out what sum of section scores you need:
Target Composite | Required sum of E + M + R |
|---|---|
30 | 89–91 |
31 | 92–94 |
32 | 95–97 |
33 | 98–100 |
34 | 101–103 |
35 | 104–106 |
36 | 107–108 |
A 35 Composite does not require three 35s. A student could earn 36 English, 35 Math, and 33 Reading for a sum of 104, which rounds to 35. This kind of planning is where a score predictor tool becomes genuinely useful, letting you model different section-score combinations.
Does Science Count Toward Your ACT Score?
On the current Enhanced ACT, Science does not count toward the Composite. ACT began phasing Science out of the Composite in April 2025 for national online testing, and by September 2025 all tests used the updated calculation.
But “optional” does not mean “irrelevant.” Science is still scored on the 1–36 scale when taken. Students who complete Science receive a STEM score (the average of Math and Science), and some colleges, scholarship programs, and STEM-focused admissions tracks may still value it.
Tutors and counselors on LinkedIn stress this point consistently. One tutoring firm recommends that many students still take Science until their target colleges’ policies are clear, especially for STEM-leaning applicants.
Reddit threads show the same confusion from students asking whether old Science scores still affect Superscores and whether retaking Science is worthwhile. The short answer: Science cannot raise or lower your Enhanced ACT Composite, but it can appear on your score report as a separate data point.
A practical decision rule:
Skip Science if your target schools do not require or recommend it and studying for it would take time away from English, Math, or Reading.
Take Science if your target schools mention it, you are applying to STEM programs, or your state/district testing requires it.
ACT Percentiles: What Your Score Means
An ACT score chart tells you what score you earned. Percentiles tell you what that score means relative to other test-takers.
ACT publishes national ranks each year based on recent graduating classes. Here are selected percentiles from ACT’s 2026–2027 national rank table, which uses data from graduates in 2024, 2025, and 2026:
Composite | National percentile |
|---|---|
18 | 52nd |
20 | 63rd |
22 | 72nd |
24 | 80th |
28 | 91st |
30 | 94th |
32 | 97th |
34 | 99th |
The mean Composite for the 2026–2027 reporting year is 19.1. The national average Composite for graduating high school students was 19.4 in 2024.
A “good” ACT score depends entirely on context. A 24 Composite sits at about the 80th percentile nationally, which sounds strong, but competitive schools routinely expect scores in the 30+ range. Always compare your score to the middle 50% range at your target colleges rather than relying on national percentiles alone.
If you are weighing whether the ACT or SAT better suits your strengths, a comparison of key differences can help frame the decision.
ACT College Readiness Benchmarks
ACT also publishes College Readiness Benchmarks, which represent the minimum scores associated with a high probability of success in first-year college courses. Students who meet a benchmark have roughly a 50% chance of earning a B or better in the corresponding course. The current benchmarks are:
English: 18
Math: 22
Reading: 22
Science: 23
These benchmarks are useful for understanding whether your section scores suggest college readiness in each subject area, separate from your Composite.
How Many Questions Can I Miss for Each Score? (Quick Reference)
This is one of the most common questions students ask. Below is a condensed version of the conversion charts showing how many questions you can miss and still hit common target scores. These numbers are approximate and vary by test form.
Target Score | English (out of 40) | Math (out of 41) | Reading (out of 27) |
|---|---|---|---|
36 | Miss 0 | Miss 0 | Miss 0 |
34 | Miss 2 | Miss 2 | Miss 2 |
32 | Miss 4 | Miss 4 | Miss ~3 |
30 | Miss 6 | Miss 6 | Miss 4 |
28 | Miss 8 | Miss 9 | Miss 5 |
26 | Miss 10 | Miss 12 | Miss 7 |
24 | Miss 13 | Miss 15 | Miss 9 |
Students on Reddit often ask “how many can I miss and still get a 30?” The honest answer: it depends on the test form. The same raw score can map to different scaled scores on different forms, so there is no guaranteed number. The table above is a reasonable estimate for planning purposes.
Common ACT Score Chart Mistakes
Misunderstanding how ACT score charts work leads to predictable errors. Here are the five most common.
Mistake 1: Using the legacy four-section Composite formula. Many prep books, older articles, and even some ranking websites still calculate Composite as (E + M + R + S) ÷ 4. On the Enhanced ACT, Composite uses only English, Math, and Reading.
Mistake 2: Using the wrong chart for a practice test. Each ACT form has its own raw-to-scaled conversion. A generic chart from the internet will not match the specific test you scored.
Mistake 3: Counting field-test questions in your raw score. The Enhanced ACT embeds experimental items that do not count. If you are scoring an official practice test, follow the official scoring key and skip the items it marks as field-test.
Mistake 4: Treating percent correct as your ACT score. Getting 80% of Math questions correct does not mean you scored a 29 (which is roughly 80% of 36). The ACT score chart converts raw counts to scaled scores through equating, and the relationship is nonlinear.
Mistake 5: Assuming optional Science is useless. Science does not affect the Composite, but it still generates a section score and contributes to STEM scoring. Dismissing it entirely without checking your target schools’ policies is a strategic mistake.
For targeted section practice to close score gaps, ACT practice questions organized by skill can help you focus where it matters most.
ACT Score Chart vs. SAT Score Conversion
Students sometimes confuse an ACT score chart with an ACT-to-SAT conversion. These are different tools.
An ACT score chart converts raw ACT answers into 1–36 ACT section scores. An ACT/SAT concordance table compares your ACT score to a roughly equivalent SAT score. ACT and College Board maintain official concordance tables, but ACT emphasizes that concordance provides comparable scores, not a guarantee of performance on the other exam.
As a rough reference, an ACT Composite of 34 corresponds to an SAT total around 1500 using the official concordance. For a detailed walkthrough of how these conversions work, see the full ACT to SAT concordance guide.
What to Do After You Calculate Your Score
Understanding an ACT score chart is step one. The next step is using that information to improve.
Once you have converted your raw scores to scaled scores using the charts above, identify which section is pulling your Composite down. Because Enhanced ACT Composite only uses three sections, a single weak section has outsized impact. Raising one section score by 3 points moves your Composite by a full point.
Track your section scores over multiple practice tests to spot patterns. A score predictor or analytics dashboard makes this easier than doing it by hand.
Start ACT prep with Miyagi to get a diagnostic, personalized study path, and section-by-section analytics that show exactly which skills are holding back your predicted score.
Frequently Asked Questions
What is the highest ACT score?
The highest possible ACT Composite score is 36. Each section (English, Math, Reading, and Science if taken) is also scored on a 1–36 scale.
Is the ACT scored on a curve?
Not in the traditional classroom sense. ACT uses equating, a statistical process that adjusts raw-to-scaled score conversions so that a 30 on one test date represents the same ability level as a 30 on another. The number of students who score well or poorly on a given test date does not change anyone else’s score.
How many questions can I miss and still get a 30?
There is no fixed answer. Because each ACT form uses a different score chart, the number of questions you can miss for any target score varies by test. On most forms, missing about 6 questions in English or Math will land you near a 30. In Reading, with only 27 scored questions, missing 4 typically puts you around a 30. Use the conversion charts above for a closer estimate, and check your specific test form’s scoring key for the most accurate conversion.
Does ACT Writing affect the Composite score?
No. ACT Writing is scored separately on a 2–12 scale and has no impact on the Composite.
Does Science still affect the ACT Composite?
On the current Enhanced ACT, no. Science is optional and does not factor into the Composite calculation. It is reported as a separate section score if taken.
Can I compare my ACT score to an SAT score?
Yes, using ACT and College Board’s official concordance tables. These tables provide comparable scores across the two tests but are not exact predictions of how you would perform on the other exam. ACT has confirmed that the current concordance remains valid for Enhanced ACT scores.
Should I use an online calculator instead of a chart?
Online calculators are convenient, but they are only as accurate as the conversion data behind them. If you took an official practice test with its own scoring key, that test’s specific chart will be more accurate than any generic calculator. Use calculators for quick estimates during prep and official charts for serious scoring.
Are older ACT practice tests still useful?
Yes, for content practice. The question types and skills tested remain similar. But keep in mind that timing, section length, and scoring rules differ on the Enhanced ACT. If you use an older test, adjust your scoring method to reflect the current three-section Composite formula and be aware that the raw-to-scaled chart from an old form may not perfectly predict Enhanced ACT conversions.