
Desmos SAT Guide 2026: 12 Tips to Solve Math Faster
Miyagi Labs ·
Desmos SAT Guide 2026: 12 Tips to Solve Math Faster

TL;DR
The Digital SAT gives you a built-in Desmos graphing calculator on all 44 math questions, and roughly half of them can be solved with Desmos alone. But using it reflexively on every problem will cost you time. This guide covers 12 specific Desmos SAT techniques organized by problem type, explains when to skip the calculator entirely, and flags the common mistakes that trip up even prepared students.
Quick Answer: How Should You Use Desmos on the SAT?
Use Desmos strategically, not automatically. The built-in graphing calculator is available for all 44 SAT Math questions and is especially useful for graphing intersections, finding zeros, identifying quadratic vertices, testing answer choices, running regressions, and checking functions. For simple arithmetic, one-step algebra, or questions you can solve mentally in a few seconds, solving by hand is usually faster.
Best rule: Use Desmos when the graph or numerical calculation is faster than the algebra. Skip it when the calculation itself takes longer than solving the problem by hand.
When Should You Use Desmos on the SAT?
The fastest SAT Math students do not use Desmos on every question. They quickly classify each problem as graph it, calculate it, or solve it by hand.
Question type | Best approach | Why |
|---|---|---|
System of equations | Desmos | Intersection gives the solution immediately |
Quadratic roots | Desmos | Click the x-intercepts instead of factoring |
Quadratic minimum/maximum | Desmos | Vertex gives the answer directly |
Complicated parameter problem | Desmos | Sliders can reveal the required value quickly |
Multiple-choice algebra | Desmos or answer choices | Testing choices can be faster than symbolic algebra |
Regression/data modeling | Desmos | Regression calculates the model automatically |
Circle in general form | Desmos | Graphing can reveal the center and radius |
Inequality system | Desmos | Shading shows the solution region |
Function evaluation | Either | Desmos is useful for checking or handling complicated expressions |
Simple arithmetic | Hand | Typing usually takes longer |
One-step equation | Hand | Mental algebra is usually faster |
Easy percentage calculation | Hand or Desmos | Use whichever requires fewer steps |
The 15-Second Rule
Before opening Desmos, ask yourself one question:
Can I solve this accurately in about 15 seconds without the calculator?
If yes, solve it by hand.
If no, consider whether Desmos can turn the problem into a graph, intersection, numerical calculation, table, or regression. The goal is not to use the calculator more. The goal is to use it when it reduces the number of steps you need to perform.
Why Desmos SAT Skills Matter More Than You Think
The Digital SAT has no “no-calculator” section. Every single math question across both modules gives you access to a built-in Desmos graphing calculator. That’s 44 questions, two 35-minute modules, and one powerful tool sitting right on your screen.
According to multiple SAT prep sources, approximately half of SAT math questions can be solved using Desmos alone. One experienced SAT tutor estimates the calculator “can often break 15–20 problems across the two math modules.” That’s a lot of algebra you can skip.
But here’s the catch: the SAT now includes questions specifically designed to slow down students who reach for Desmos reflexively. The difference between using Desmos strategically and using it on everything can easily be 50 to 100 points.
These aren’t tricks. They’re repeatable techniques organized by problem type. If you want a structured, topic-by-topic learning path for all of them, start with our complete Desmos SAT guide.
Desmos SAT Techniques: Quick Reference
Technique | Best SAT problem type | Potential benefit | Difficulty |
|---|---|---|---|
Graph intersections | Systems of equations | Very high | Easy |
Find zeros | Quadratics and polynomials | High | Easy |
Read the vertex | Minimum/maximum questions | High | Easy |
Slider sweep | Parameter questions | Very high | Medium |
Test answer choices | Multiple-choice algebra | High | Easy |
Regression | Data and modeling | Very high | Medium |
Circle graphing | Coordinate geometry | High | Easy |
Inequality shading | Systems of inequalities | Medium | Easy |
Statistics functions | Mean and median | Medium | Medium |
Percentage calculations | Percentage questions | Low | Easy |
Function evaluation | Function-value questions | Medium | Easy |
Triage | All Math questions | Very high | Critical |
Important: The actual time saved depends on the student's familiarity with Desmos and the specific SAT question. Treat these categories as strategy guidance rather than guaranteed time savings.
Now let’s break each one down.
How to Practice Desmos for the SAT
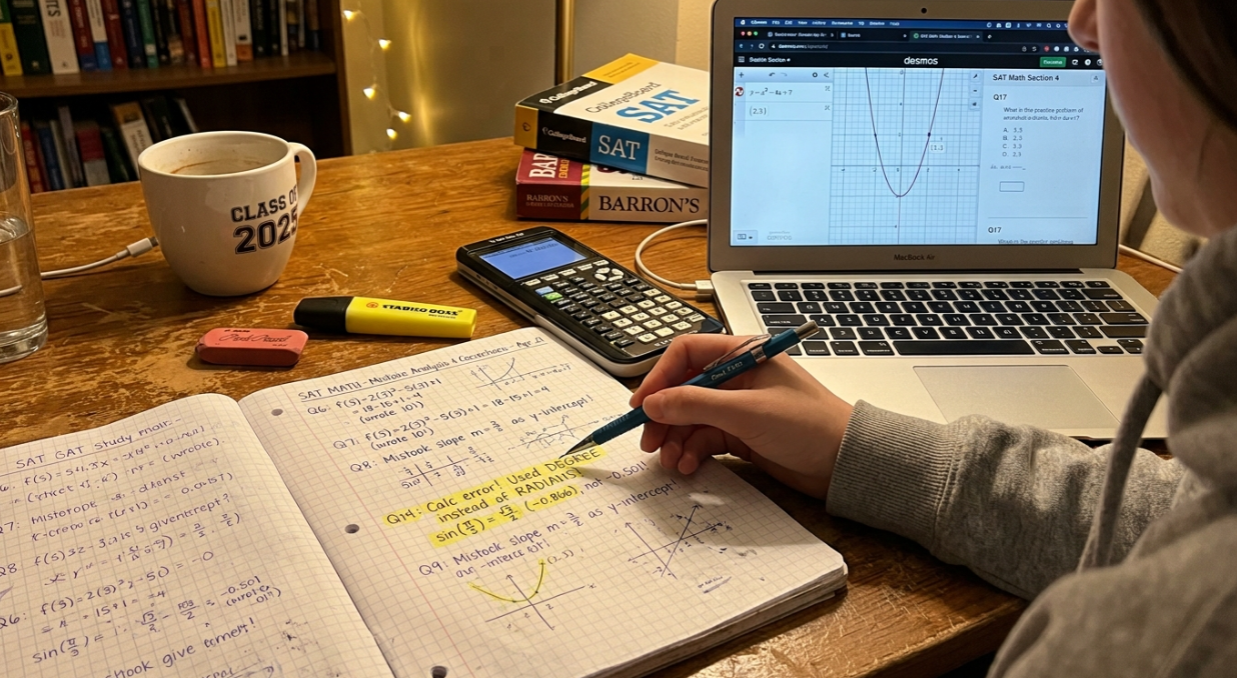
The goal of Desmos practice is not simply learning where the buttons are. You need to develop the judgment to recognize when the calculator is faster than solving manually.
Step 1: Learn one technique at a time
Start with the highest-value skills: intersections, zeros, vertices, answer-choice testing, and regression. Practice each technique on several different question types.
Step 2: Practice under a time limit
Once you know the technique, use timed SAT Math questions. The challenge is to decide whether Desmos actually saves time when the clock is running.
Step 3: Compare calculator and manual methods
After each practice question, ask:
Could I have solved this faster by hand?
Did Desmos reduce the number of steps?
Did I make an input mistake?
Did I spend too long adjusting the graph?
Would I recognize this problem type on test day?
Step 4: Build a Desmos error log
Record calculator mistakes separately from math mistakes. Common calculator errors include entering an equation incorrectly, using the wrong variable, missing parentheses, reading an approximate value as exact, or failing to find a point outside the current viewing window.
Step 5: Practice the decision, not just the technique
Eventually, the goal should be automatic recognition:
Simple problem → solve by hand.
Graph-friendly problem → use Desmos.
Uncertain or complicated problem → test whether Desmos reduces the work.
What Can Desmos Do on the SAT?
The built-in Desmos calculator is most useful when a problem can be converted into a graph, numerical calculation, table, or regression. Knowing what the calculator can and cannot do helps you decide whether opening it will actually save time.
Desmos is especially useful for:
Graphing equations and functions
Finding intersections
Finding x-intercepts and zeros
Identifying quadratic vertices
Evaluating functions
Testing multiple-choice answers
Creating tables
Running linear and quadratic regressions
Graphing inequalities
Exploring equations with sliders
Performing numerical calculations
Desmos is not a symbolic algebra system
Desmos does not automatically perform every algebraic manipulation a student might normally do on paper. It is not designed to replace understanding of factoring, simplifying expressions, solving equations symbolically, or interpreting mathematical relationships.
Think of Desmos as a tool for visualizing, calculating, testing, and verifying rather than as a replacement for SAT Math fundamentals.
1. Solve Systems of Equations by Graphing
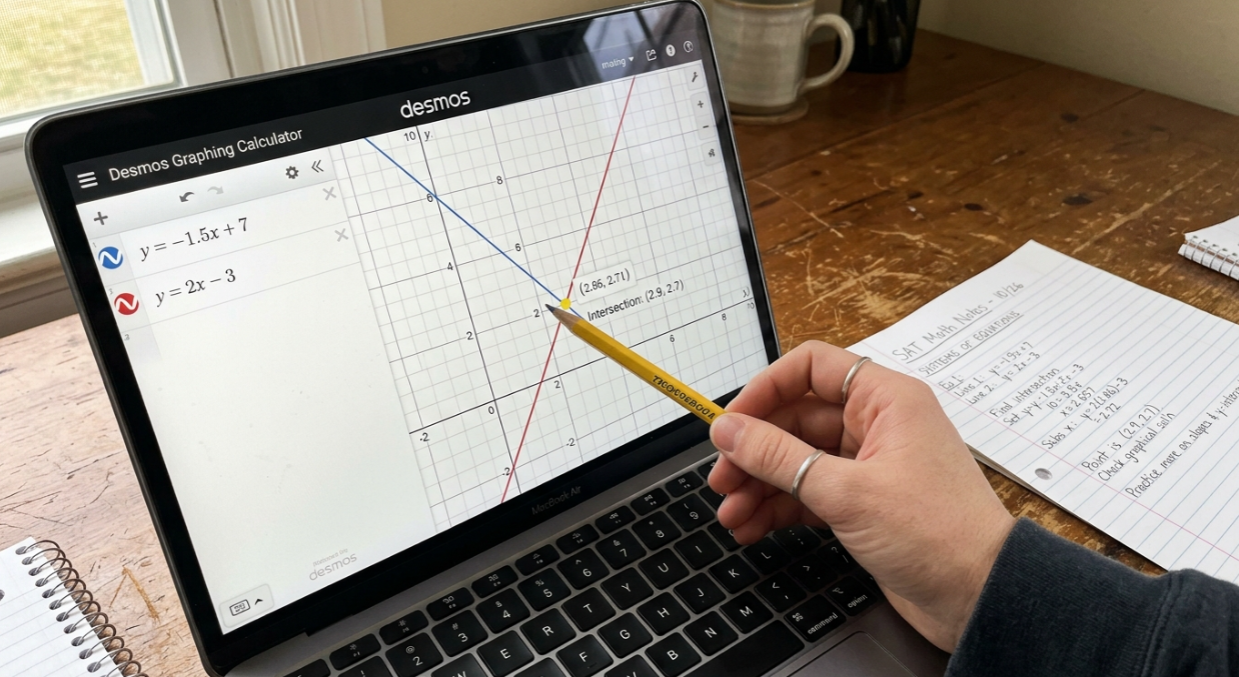
Best for: Systems where you need the value of x, y, or the point where two equations intersect.
How to do it
Enter each equation as a separate expression in Desmos. The graph displays both equations. Select their intersection point to see the coordinates.
For example, if the SAT gives you two equations and asks for the solution, graph both equations instead of immediately using substitution or elimination.
When Desmos saves time
Use graphing when the equations would require several algebraic steps, especially when the equations are awkward to manipulate.
When to solve by hand
If one equation can be substituted into the other immediately or the solution is obvious, solving manually may be faster.
Common mistake
Make sure the intersection is actually visible. If the graphs appear not to intersect, zoom out before concluding that there is no solution.
For a step-by-step walkthrough, see the systems of equations lesson.
2. Find Zeros and Roots Without Factoring
Best for: Quadratic and polynomial questions asking for roots, x-intercepts, or solutions.
Graph the equation, then click the x-intercepts. Desmos labels them with their coordinates. You skip factoring entirely.
This technique is especially powerful for what experienced tutors call “almost-factorable” quadratics. These are expressions the SAT designs to look factorable but require messy numbers, wasting your time if you try to factor by hand. With Desmos, it takes the same ten seconds regardless of whether the roots are clean integers or ugly fractions.
Type the expression as y = [your equation] and read off where y equals zero. For polynomials with more than two roots, zoom out to make sure you’ve found them all.
Go deeper with the finding roots lesson.
3. Read Vertex, Min, and Max Directly from the Graph
Best for: Questions asking for the minimum value, maximum value, or vertex of a quadratic function.
Graph the quadratic. Click the vertex point. Desmos gives you the exact coordinates.
This eliminates the vertex formula (x = -b/2a) and completing the square, both of which are slow and error-prone under time pressure. The vertex appears as a labeled dot on the parabola. If the question asks for the minimum value of y, you just read the y-coordinate. If it asks for the x-value that produces the minimum, read the x-coordinate.
One detail to watch: if the quadratic opens downward, the vertex is a maximum, not a minimum. Desmos makes this visually obvious, which actually helps you avoid a common misread.
Practice this technique in the vertex and min/max lesson.
4. Use Sliders to Sweep Unknown Parameters
Best for: Questions with an unknown coefficient or constant, like “for what value of a does the system have no solution?” or “what value of k makes the equation have exactly one solution?”
This is a medium-difficulty technique with a huge payoff on hard-module questions. When a problem includes an unknown parameter, Desmos lets you add a slider for that variable. You then drag the slider and watch the graph change in real time until it matches the condition the question describes.
For example, if a problem asks which value of a makes two lines parallel, graph both lines with a as a slider. Drag until the lines never intersect. The slider value is your answer.
Why it matters: These questions appear disproportionately in Module 2 (the harder adaptive module), where each correct answer is worth more. Students who know the slider sweep technique can solve problems that would otherwise require advanced algebra.
The slider sweep lesson walks through several SAT-style examples.
5. Backsolve Multiple-Choice Answers
Best for: Any multiple-choice algebra question where plugging in a value is faster than solving symbolically.
The SAT gives you four answer choices. On many questions, you can type the expression into Desmos, substitute each answer choice, and see which one works. This is especially fast when full algebraic manipulation would take two or more minutes.
Here’s the process: define your equation in Desmos, then evaluate it at each answer choice. If the question asks “which value of x satisfies [equation],” type the equation, graph it, and check which answer choice lands on the curve.
A Scribd-based SAT math guide praised this approach, calling Desmos “absolutely GOATED” and noting it “can help you solve problems in seconds instead of minutes.”
Key advantage: This method works even when you have no idea how to solve the problem algebraically. If you’re stuck, try the answer choices.
Explore this technique further in the answer-choice testing lesson.
6. Run Regressions with the Tilde Trick
Best for: Scatterplot questions, line-of-best-fit problems, and data modeling questions.
This is one of the most underused Desmos SAT techniques, and it can turn a three-minute problem into a 45-second one.
Here’s how it works:
Open a table in Desmos (Ctrl+Alt+T is the keyboard shortcut).
Enter the data points from the question.
In a new expression line, type
y1~mx1+bfor a linear regression, ory1~ax1^2+bx1+cfor a quadratic regression.Desmos outputs the coefficients.
The tilde character (~) tells Desmos to find the best fit rather than graph an exact equation. Typing Shift+backtick produces the tilde. Most articles mention this technique but don’t explain it clearly enough for someone who has never used it before. The regression technique walkthrough includes worked examples with actual SAT-style data.
Common mistake: Forgetting to use x1 and y1 (referencing the table columns) instead of plain x and y.
7. Graph Circle Equations Without Completing the Square
Best for: Coordinate geometry questions involving circles, especially those given in general form.
When the SAT gives you a circle equation in general form (like x² + y² + 6x - 4y - 12 = 0), most students are expected to complete the square to find the center and radius. With Desmos, you just type the equation directly. Desmos graphs the circle, and you can click to find the center coordinates and measure the radius visually.
This saves a solid 60 to 90 seconds on questions that specifically ask for the center or radius. It also eliminates sign errors in the completing-the-square process, which are one of the most common mistakes on these problems.
The circle equation lesson covers both standard and general form examples.
8. Shade Inequalities to Identify Solution Regions
Best for: Questions asking which region satisfies a system of inequalities, or which point is in the solution set.
Type the inequality directly into Desmos (for example, y > 2x + 3), and it shades the valid region. For a system of two or more inequalities, enter each one on its own line. The overlapping shaded area is your solution region.
This eliminates the guesswork of “which side of the line?” that causes errors when students try to test points by hand. It also makes it visually obvious when answer choices fall inside or outside the region.
Quick tip: If the question gives you a strict inequality (>) vs. a non-strict inequality (≥), Desmos shows the boundary line as dashed or solid accordingly. This detail occasionally matters for SAT questions asking whether a boundary point is included.
9. Use Built-In Statistics Functions
Best for: Questions involving mean, median, or other summary statistics of a data set.
This is a community-sourced tip that most Desmos SAT articles miss entirely. You can type mean(2, 5, 8, 11, 14) or median(2, 5, 8, 11, 14) directly into Desmos, and it computes the answer.
A SAT tutor on MathChops Substack shared an even better trick: you can find the unknown number that makes the mean equal the median by typing something like mean(2,3,4,5,x) = median(2,3,4,5,x). This kind of problem is “a bit tedious with algebra but a snap with Desmos.”
Why this matters for the SAT: Data and statistics questions appear throughout both math modules. Being able to compute summary statistics instantly, especially when solving for an unknown value in a data set, gives you a real speed advantage.
Practice these functions in the statistics lesson.
10. Speed Up Percentage Problems with the % Shortcut
Best for: Word problems involving percentages, percent increase, or percent decrease.
The same MathChops tutor noted that when you type the % symbol in Desmos, it automatically inserts “of”. So if the question asks “what is 75% of 253,” you type 75% (Desmos inserts “of”), then 253, and you get the answer.
This is a small time saver per question, but percentage problems are common enough on the SAT that it adds up. It also reduces the chance of making a decimal-placement error when converting percentages manually.
11. Evaluate Functions at Specific Values
Best for: Questions asking for f(3), g(-2), or the output of a composite function at a given input.
Define the function in Desmos (type f(x) = 3x² - 2x + 5), then on the next line type f(3). Desmos instantly returns the value. For composite functions, define both functions and type f(g(2)).
This is the fastest verification method for function-value questions and grid-in problems. One SAT prep community advises using Desmos to verify your manual work on grid-in questions specifically because “grid-ins have no answer choices to guide you, which means there’s no safety net if you made a calculation error.”
Want to build fluency with this approach? Try Desmos SAT practice problems that include function evaluation questions.
12. Know When NOT to Use Desmos
Best for: Protecting your time on questions where Desmos actually slows you down.
This is the most important skill on this list, and the one competitors almost never cover well.
Desmos saves time when the graph, intersection, zero, or table is the mathematics the question already asks for. It wastes time when you type a long expression that could be simplified mentally in one step.
Here’s a simple decision rule: if you can solve the problem in under 15 seconds without a calculator, skip Desmos. Examples include single-step arithmetic, basic percentage conversions, simple one-variable equations, and interpreting a graph that’s already shown.
The SAT has evolved. Recent tests include what practitioners call “trap questions,” problems designed to punish students who reach for Desmos reflexively. These often involve expressions that look complicated but simplify quickly with mental math or estimation. Typing them into Desmos takes longer than thinking through them.
One prep source recommends a useful habit: “use estimation first.” Before opening Desmos, take three seconds to estimate the answer. If you can narrow it down to one answer choice, you’re done.
For a complete framework on when to use Desmos versus when to solve by hand, see the Desmos triage guide.
Desmos SAT Shortcuts Worth Memorizing
You do not need to memorize dozens of Desmos commands for the SAT. Focus on the shortcuts that repeatedly reduce the number of clicks or keystrokes.
Shortcut or feature | What it does | Best use |
|---|---|---|
| Creates an exponent | Quadratics and powers |
| Creates a fraction | Exact calculations |
| Runs a regression | Data and modeling |
Function notation | Evaluates a defined function | Function questions |
Sliders | Changes a parameter dynamically | Parameter questions |
Tables | Organizes x/y data | Regression and data problems |
Graph intersections | Finds where equations meet | Systems |
x-intercepts | Finds zeros | Quadratics and polynomials |
Vertex selection | Finds a quadratic's turning point | Minimum/maximum questions |
The most important shortcut is not a keyboard command: recognizing when a graph will answer the question faster than algebra.
Which SAT Math Topics Benefit Most From Desmos?
Desmos can help across several SAT Math domains, but some question types are particularly well suited to graphing and numerical methods.
SAT Math topic | Desmos technique | Usefulness |
|---|---|---|
Algebra | Graph intersections and test answers | High |
Advanced Math | Roots, vertices, sliders | Very high |
Problem-Solving and Data Analysis | Tables and regressions | High |
Geometry | Circle and coordinate graphing | Medium to high |
Trigonometry | Function evaluation and graphing | Medium |
Simple arithmetic | Usually solve by hand | Low |
The most valuable Desmos skills are therefore concentrated in Algebra, Advanced Math, and data-related questions, where graphing or numerical calculations can replace multiple manual steps.
Common Desmos SAT Mistakes to Avoid
Even students who know all twelve techniques above lose points to input errors. Here are the most frequent ones.
Degree vs. radian mode mismatch. The SAT version of Desmos defaults to degrees, which is correct for SAT trig questions. But if you’ve been practicing on the regular Desmos site (which defaults to radians), you might accidentally switch modes. The #1 trig mistake on the SAT is checking sin(30) in radian mode and getting -0.988 instead of 0.5. Click the wrench icon to confirm you’re in degree mode before any trig problem.
Missing parentheses. Typing 1/2x+3 is not the same as 1/(2x+3). Most errors are input errors, specifically missing parentheses around a numerator or denominator. Desmos follows strict order of operations, so bracket everything you’re not 100% sure about.
Confusing multiply with the variable x. This is surprisingly easy to do on a small screen. If you mean “2 times x,” make sure Desmos registers it as multiplication and not the letter x preceded by 2.
Graph appears blank. This usually means your viewing window is too zoomed in or too zoomed out. Pinch to zoom or click the home icon to reset the view.
Reading approximate values as exact. When you click an intersection point, Desmos sometimes shows a rounded decimal. If the answer choices are fractions, double-check that your decimal matches the correct fraction.
Keyboard Shortcuts Worth Memorizing
You won’t have a mouse on test day if you’re on a laptop, so knowing keyboard shortcuts matters. Four critical shortcuts: Ctrl+Alt+T opens a table, Ctrl+Z undoes your last action, the caret key (^) types exponents, and Shift+backtick (~) produces the tilde for regression. Additionally, typing / auto-formats a fraction, and clicking the wrench icon switches between degree and radian mode.
SAT Desmos vs. Regular Desmos: Key Differences
The SAT version is nearly identical to the public Desmos calculator, but a few differences matter:
Keyboard layout: The on-screen keypad is alphabetical, not QWERTY.
Missing functions: csc, sec, cot, and their inverses are unavailable. You won’t need them on the SAT, but knowing this prevents confusion.
No file management: You cannot save, import, upload images, add notes, or create folders.
2D only: Desmos does not factor polynomials, expand binomials symbolically, or simplify algebraic fractions. It graphs. It computes. But it doesn’t do symbolic algebra.
CAS calculators are banned: Starting August 2025, CAS calculators have been prohibited from all SAT administrations. You can still bring an approved non-CAS handheld alongside the built-in Desmos.
The default angle mode is degrees, which aligns with SAT content. If you’re studying on desmos.com, practice switching to degree mode so it feels natural.
How to Practice These Desmos SAT Techniques
Reading about these techniques is not enough. You need to build muscle memory so that on test day, your fingers move faster than your anxiety.
Step 1: Practice each technique individually. Go to desmos.com/practice and select College Board tests for an interface that closely matches the real SAT. Work through problems by category (systems, then quadratics, then regression) until each technique feels automatic.
Step 2: Take full-length practice tests under realistic timing. The best way to build judgment about when to use Desmos versus when to skip it is to feel the time pressure of 35 minutes per module.
Practice with SAT exams that simulate the digital format, so test day isn’t the first time you’re managing the clock alongside the calculator.
Step 3: Review your mistakes with a focus on process. For every missed question, ask: “Would Desmos have been faster here?” and “Did I waste time on Desmos when I should have solved it by hand?” This feedback loop is what turns technique knowledge into score points.
If you want a structured approach, Miyagi Labs’ SAT prep includes a 24/7 AI tutor, a diagnostic test, and a personalized study path that covers Desmos techniques alongside every other SAT math topic. It’s built to help you figure out not just what you got wrong, but which approach would have been fastest.
Desmos SAT Test-Day Checklist
Before test day, make sure you can do these tasks without stopping to figure out the interface:
Graph two equations and find their intersection.
Find the x-intercept of a quadratic.
Identify the vertex of a parabola.
Create and adjust a slider.
Test answer choices with a graph or substitution.
Enter data into a Desmos table.
Run a linear regression.
Run a quadratic regression.
Graph an inequality.
Evaluate a function such as
f(3).Check the calculator's angle mode before using trigonometry.
Zoom and reset the graph when an important point is outside the viewing window.
Recognize when solving by hand is faster.
The goal is not to memorize every Desmos feature. It is to make the common operations automatic enough that using the calculator does not interrupt your SAT pacing.
Frequently Asked Questions
Is Desmos allowed on the SAT?
Yes. The Desmos graphing calculator is built into the Digital SAT testing software and available for all 44 math questions across both modules. There is no no-calculator section on the current SAT.
What’s the difference between SAT Desmos and regular Desmos?
The SAT version uses an alphabetical keyboard instead of QWERTY, disables csc/sec/cot and their inverses, and doesn’t allow file saving or image uploads. Everything else, including tables, sliders, regression, and functions, works identically to the public site at desmos.com.
Can I bring my own calculator AND use Desmos on the SAT?
Yes. You can bring an approved non-CAS handheld calculator alongside the built-in Desmos. However, CAS calculators have been banned from all SAT administrations since August 2025.
How many SAT questions can Desmos solve?
Roughly half of SAT math questions (around 22 out of 44) can be solved with Desmos alone. Even more can be partially solved or verified with it. The exact number varies by test form.
Should I use Desmos on every SAT math question?
No. Using Desmos on simple arithmetic or single-step algebra wastes time. The SAT includes questions designed to slow down students who reach for the calculator on everything. A good rule of thumb: if you can solve it mentally in under 15 seconds, skip Desmos.
What is the most common Desmos mistake on the SAT?
The degree/radian mode mismatch. The SAT version defaults to degrees, which is correct. But students who practice in radian mode get wrong trig values on test day. Always check the wrench icon before solving trig problems.
How do I practice using Desmos for the SAT?
Use desmos.com/practice with College Board test settings for an interface that matches the real exam. Then take full-length timed practice tests to build judgment about when Desmos helps and when it doesn’t. You can also explore Desmos practice questions designed specifically for SAT problem types.
Does Desmos do algebra or just graphing?
Desmos graphs equations, computes numerical values, runs regressions, and evaluates functions. It does not factor polynomials, expand expressions symbolically, or simplify algebraic fractions. It’s a graphing and computing tool, not a computer algebra system.